
合 SQL Server活动监视器介绍
Tags: MSSQLSQL Server优化性能性能监视活动监视器
- 简介
- 什么是SQL Server活动监视器? (What is SQL Server Activity Monitor?)
- 如何启动活动监视器 (How to start Activity Monitor)
- 工具栏
- 在启动时启动活动监视器和对象资源管理器
- 设置活动监视器刷新间隔
- 活动监视器窗格 (Activity Monitor panes)
- 概述窗格 (The Overview pane)
- 进程窗格 (The Processes pane)
- 资源等待窗格 (The Resource Waits pane)
- 数据文件I / O窗格 (The Data File I/O pane)
- 最近的昂贵查询窗格 (The Recent Expensive Queries pane)
- 使用活动监视器的要求 (Requirements to use Activity Monitor)
- 参考
简介
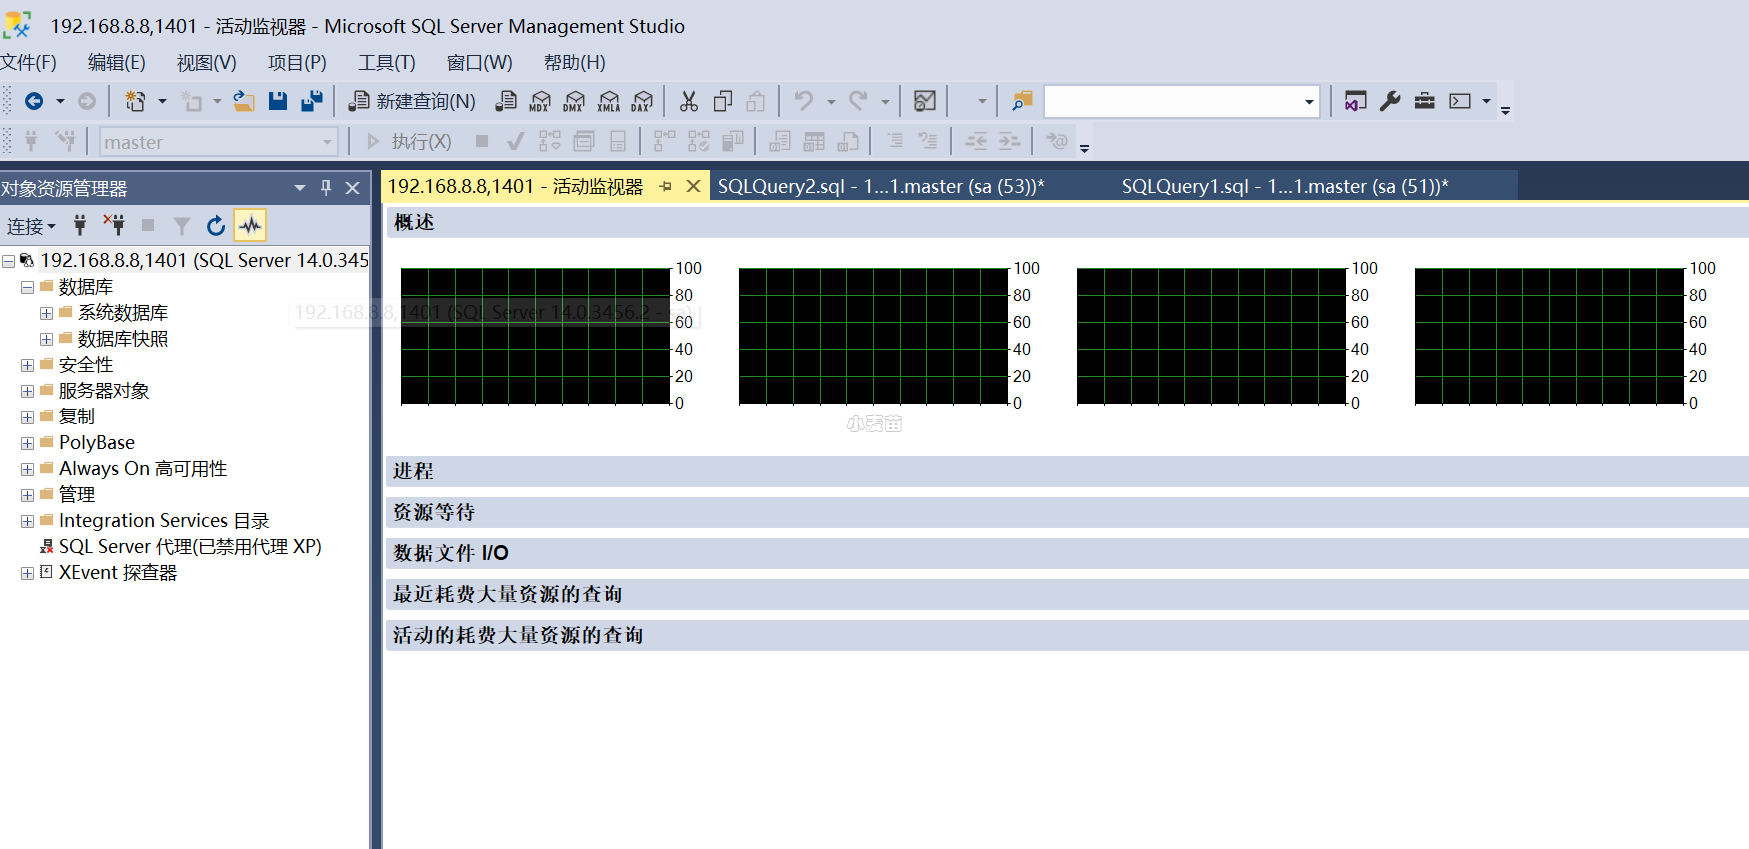
活动监视器是一个带有以下可展开和折叠的窗格的选项卡式文档窗口:“概述”、“进程”、“资源等待”、“数据文件 I/O”、“最近耗费大量资源的查询”和“耗费大量资源的活动查询”。 展开任何窗格时,活动监视器都将查询实例以获取相关信息。 折叠窗格时,该窗格的所有查询活动都将停止。 可以同时展开一个或多个窗格,以查看实例上不同种类的活动。
什么是SQL Server活动监视器? (What is SQL Server Activity Monitor?)
SQL Server Activity Monitor is a feature in SQL Server Management Studio that displays information about the SQL Server processes and their effect on SQL Server performance
SQL Server活动监视器是SQL Server Management Studio中的一项功能,可显示有关SQL Server进程及其对SQL Server性能的影响的信息
如何启动活动监视器 (How to start Activity Monitor)
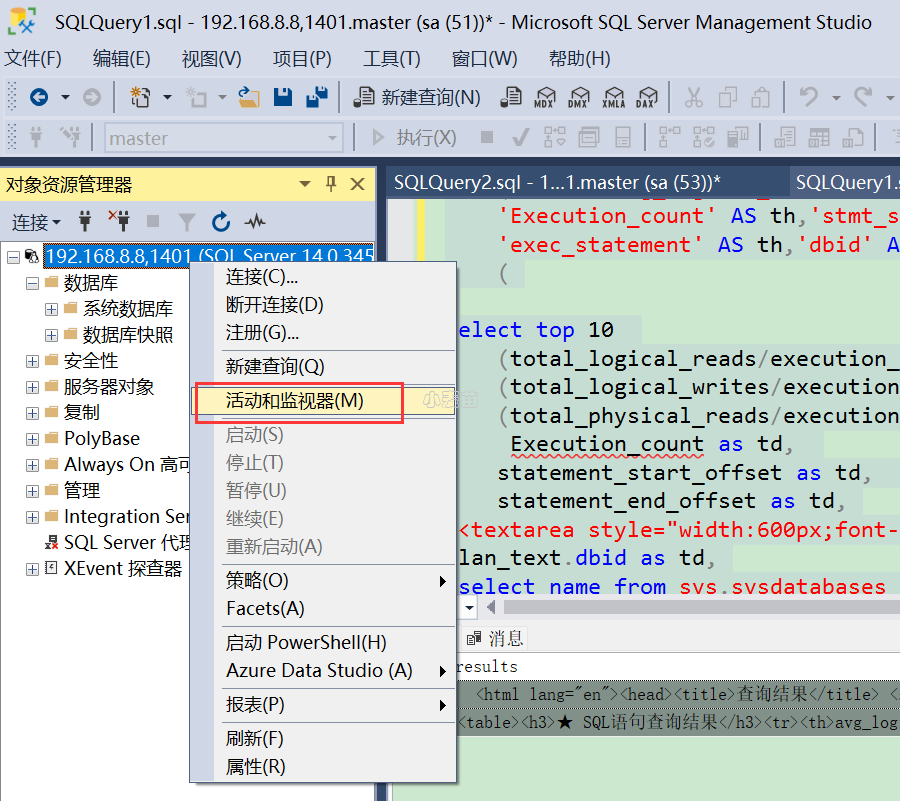
There are several ways to start Activity Monitor – in the SQL Server Management Studio toolbar click the activity Monitor icon, use the keyboard shortcut Ctrl+Alt+A, or in Object Explorer right-click the SQL Server instance and select Activity Monitor
有几种启动活动监视器的方法–在SQL Server Management Studio工具栏中单击活动监视器图标,使用键盘快捷键Ctrl + Alt + A,或者在对象资源管理器中右键单击SQL Server实例,然后选择“ 活动监视器”。
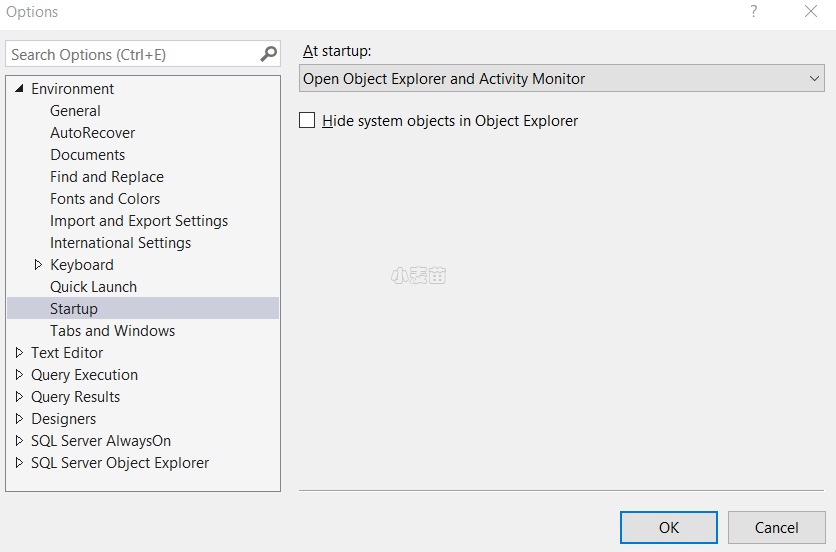
One more option is to set Activity Monitor to be opened when SQL Server Management Studio is started
另一种选择是将活动监视器设置为在启动SQL Server Management Studio时打开
- Options选项”。
- Open the Environment | Start Up tab
- 打开环境 启动标签
- Open Object Explorer and Activity Monitor option打开对象资源管理器和活动监视器”选项
On the next SQL Server Management Studio start up, Object Explorer will be shown on the left and Activity Monitor on the right
在下一次启动SQL Server Management Studio时,对象资源管理器将显示在左侧,活动监视器将显示在右侧。
Activity Monitor is a SQL Server Management Studio feature that tracks some of the most important metrics that affect performance. It shows the metrics in real time, without the out-of-the-box solution to save them for later analysis. Filtering by a specific database/parameter is easy, but excluding a specific value is not possible. Monitoring additional metrics is also not possible. Due to its limited set of features and monitored metrics, it’s not recommended for in-depth performance monitoring
活动监视器是SQL Server Management Studio的一项功能,可跟踪一些影响性能的最重要的指标。 它实时显示指标,而无需开箱即用的解决方案来保存它们以供以后分析。 通过特定的数据库/参数进行过滤很容易,但是不可能排除特定的值。 也无法监视其他指标。 由于功能和受监视的指标集有限,因此不建议对其进行深入的性能监视
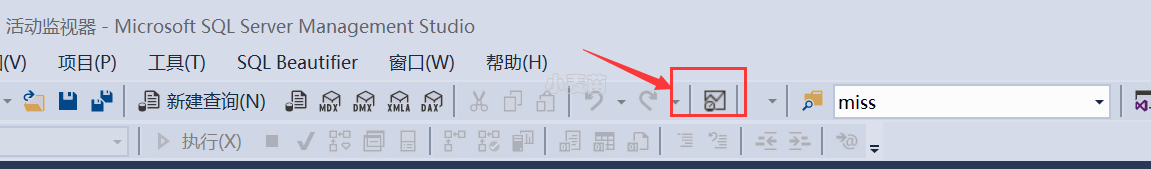
工具栏
在标准工具栏上,选择“活动监视器”图标。 该图标位于中间,就在“撤消/重做”按钮的右边。 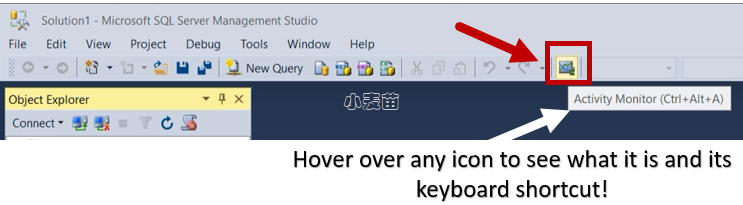
如果尚未连接到想要监视的 SQL Server 的实例,请完成“连接到服务器”对话框。
在启动时启动活动监视器和对象资源管理器
- 从 “工具” 菜单中,选择 “选项” 。
- 在“选项”对话框中,展开“环境”,再选择“启动”。
- 在“启动时”下拉列表中,选择“打开对象资源管理器和活动监视器”。
- 选择“确定” 。
设置活动监视器刷新间隔
- 打开活动监视器。
- 右键单击“概述”,选择“刷新间隔”,然后选择活动监视器获取新实例信息所用的间隔。
活动监视器窗格 (Activity Monitor panes)
Activity Monitor consists of several panes – Overview, Processes, Resource Waits, Data File I/O, and Recent Expensive Queries. Panes can be expanded and collapsed. The activities are queried only when the specific pane is expanded
活动监视器由几个窗格组成- 概述,流程,资源等待,数据文件I / O和最近的昂贵查询 。 窗格可以展开和折叠。 仅在展开特定窗格时才查询活动
“Activity Monitor runs queries on the monitored instance to obtain information for the Activity Monitor display panes. When the refresh interval is set to less than 10 seconds, the time that is used to run these queries can affect server performance” [1]
“活动监视器在受监视的实例上运行查询,以获取活动监视器显示窗格的信息。 当刷新间隔设置为小于10秒时,用于运行这些查询的时间可能会影响服务器性能” [1]
概述窗格 (The Overview pane)
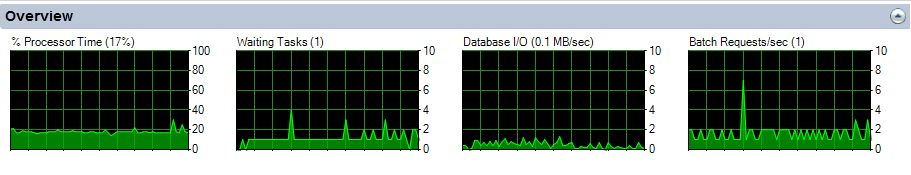
The Overview pane contains the graphs for the most important SQL Server instance information. The context menu contains the Refresh interval option that can be set to a predefined value from 1 second to 1 hour
概述窗格包含最重要SQL Server实例信息的图。 上下文菜单包含“ 刷新间隔”选项,可以将其设置为从1秒到1小时的预定义值
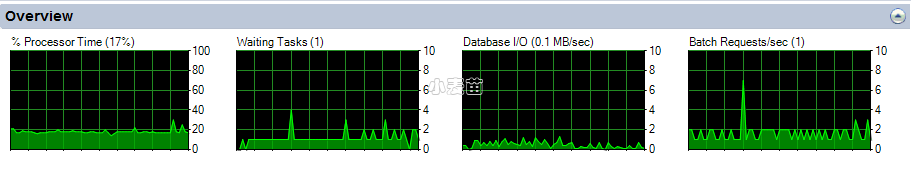
% Processor Time – is the percentage of time the processors spend to execute threads that are not idle
%Processor Time –是处理器用于执行非空闲线程的时间百分比
Waiting Tasks – is the number of tasks that are waiting for processor, I/O, or memory to be released so the tasks can be processed
等待任务 –是等待处理器,I / O或内存被释放以便可以处理任务的任务数
Database I/O – is the data transfer rate in MB/s from memory to disk, disk to memory, or disk to disk
数据库I / O –是从内存到磁盘,从磁盘到内存或从磁盘到磁盘的数据传输速率,以MB / s为单位
Batch Requests/sec – is the number of SQL Server batches received by the instance in a second
每秒批处理请求数 –是实例在一秒钟内收到SQL Server批处理数
进程窗格 (The Processes pane)
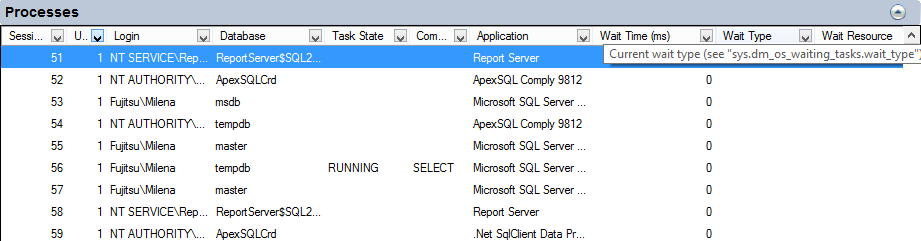
The Processes pane shows the information about the currently running processes on the SQL databases, who runs them, and from which application
“ 进程”窗格显示有关SQL数据库上当前正在运行的进程,谁运行它们以及从哪个应用程序运行的信息。
A tooltip for each table header shows a short description of the column data and system views used to obtain it. Each column can be filtered using the filters in the column header
每个表标题的工具提示显示了列数据的简短描述以及用于获取列数据的系统视图。 可以使用列标题中的过滤器过滤每列
The context menu for the specific process provides options to see the last T-SQL command batch for the process, kill it, or trace it in SQL Server Profiler
特定进程的上下文菜单提供了一些选项,以查看该进程的最后一个T-SQL命令批处理,将其杀死或在SQL Server Profiler中对其进行跟踪
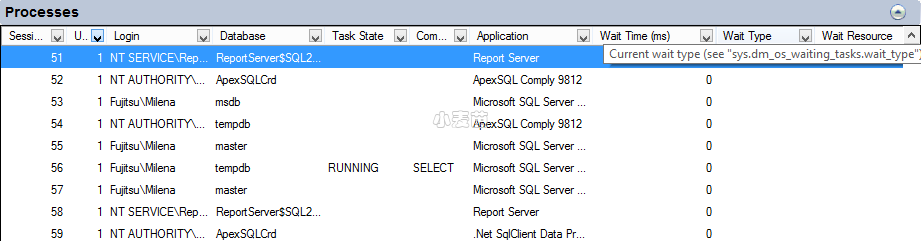
Session ID – is a unique value assigned by Database Engine to every user connection. This is the spid value returned by the sp_who procedure
会话ID –是数据库引擎分配给每个用户连接的唯一值。 这是sp_who过程返回的spid值
User Process – 1 for user processes, 0 for system processes. The default filter is set to 1, so only user processes are shown
用户进程 – 1用于用户进程,0用于系统进程。 默认过滤器设置为1,因此仅显示用户进程
Login – the SQL Server login that runs the session
登录名 –运行会话SQL Server登录名
Database – the database name on which the process is running
数据库 –运行进程的数据库名称
Task State – the task state, blank for tasks in the runnable and sleeping state. The value can also be obtained using the sys.dm_os_tasks view, as the task_state column. The states returned can be:
“PENDING: Waiting for a worker thread.
RUNNABLE: Runnable, but waiting to receive a quantum.
RUNNING: Currently running on the scheduler.
SUSPENDED: Has a worker, but is waiting for an event.
DONE: Completed.
SPINLOOP: Stuck in a spinlock.” [2]
任务状态–任务状态,处于可运行和睡眠状态的任务为空白。 也可以使用sys.dm_os_tasks视图作为task_state列获取该值。 返回的状态可以是:
“正在等待:正在等待工作线程。
可运行:可运行,但正在等待接收量子。
运行:当前正在调度程序上运行。
暂停:有工人,但正在等待事件。
完成:完成。
SPINLOOP:卡在一个自旋锁中。 [2]
Command – the current command type. The value can also be obtained using the sys.dm_exec_requests view, as the command column
Command –当前命令类型。 也可以使用sys.dm_exec_requests视图作为命令列获取该值
Application – the name of the application that created the connection
应用程序 –创建连接的应用程序的名称
Wait Time (ms) – how long in milliseconds the task is waiting for a resource. The value can also be obtained using the sys.dm_os_waiting_tasks view, as the wait_duration_ms column
等待时间(毫秒) –任务等待资源的时间(以毫秒为单位)。 该值也可以使用sys.dm_os_waiting_tasks视图作为wait_duration_ms列获得
Wait Type – the last/current wait type. The value can also be obtained using the sys.dm_os_waiting_tasks view, as the wait_type column. The waits can be resource, queue and external waits
等待类型–最后/当前的等待类型。 也可以使用sys.dm_os_waiting_tasks视图作为wait_type列获取该值。 等待可以是资源,队列和外部等待
Wait Resource – the resource the connection is waiting for. The value can also be obtained using the sys.dm_os_waiting_tasks view, as the resource_description column
