
合 diskspd测试Windows硬盘的读写速度
简介
DISKSPD 是一个可生成 I/O 的命令行工具,用于微基准测试。 Diskspd 是微软开源的磁盘性能基准测试工具,其基于命令行界面,有非常多的测试参数可用,很强大。
| 名称 | 内容 |
|---|---|
| 开发语言 | C++ |
| 界面框架 | 无(在cmd中执行命令) |
| 代码量 | 1万行 |
| 支持系统 | Windows |
| 官网地址 | https://github.com/Microsoft/diskspd/wiki |
| github地址 | https://github.com/microsoft/diskspd |
| 软件下载地址 | https://github.com/microsoft/diskspd/releases/download/v2.1/DiskSpd.ZIP |
GitHub:https://github.com/microsoft/diskspd
wiki:https://github.com/Microsoft/diskspd/wiki
测试的目标可以是文件、分区、物理驱动器中的任意一个维度。这三种的区别,就是测试范围是一个比一个大的,文件<分区<物理驱动器。
- 测试文件时,表示测试只针对这个文件,不管其在哪个分区或驱动器上;
- 测试分区时,表示只会在这个分区上读写,不会影响其他分区文件;
- 测试驱动器时,表示只会在这个驱动器上读写,不会影响其他驱动器。
安装
直接下载安装包,解压即可。
- amd64: For 64 bit operating systems
- x86: For 32 bit operating systems
- ARM64: For 32 bit operating systems
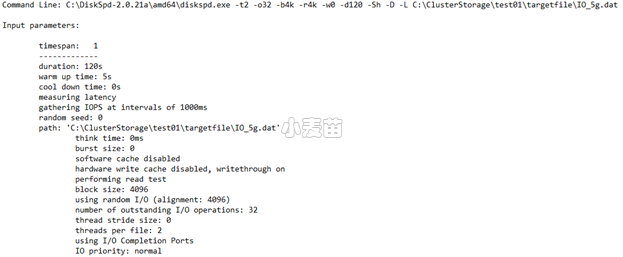
1 2 3 4 5 6 7 | 1.操作步骤 1.1. 解压文件后,例如放在D:\DiskSpd2.0.21 1.2. 在cmd 命令窗口下输入命令 d: 1.3. 在cmd 命令窗口下输入命令 cd D:\DiskSpd2.0.21\x86 1.4. diskspd.exe -o1 -b4k -r4k -w50 -d120 -Sh -D -L -c10G D:\IO.bat >D:\diskspd-IO202309171414.txt 注意:其中 D:\IO.bat 指的是测试的目录,如果ODIN放在E盘,则修改成E:\IO.bat |
帮助
1 2 3 4 5 6 7 8 9 10 11 12 13 14 15 16 17 18 19 20 21 22 23 24 25 26 27 28 29 30 31 32 33 34 35 36 37 38 39 40 41 42 43 44 45 46 47 48 49 50 51 52 53 54 55 56 57 58 59 60 61 62 63 64 65 66 67 68 69 70 71 72 73 74 75 76 77 78 79 80 81 82 83 84 85 86 87 88 89 90 91 92 93 94 95 96 97 98 99 100 101 102 103 104 105 106 107 108 109 110 111 112 113 114 115 116 117 118 119 120 121 122 123 124 125 126 127 128 129 130 131 132 133 134 135 136 137 138 139 140 141 142 143 144 145 146 147 148 149 150 151 152 153 154 155 156 157 158 159 160 161 162 163 164 165 166 167 168 169 170 171 172 173 174 175 176 177 178 179 | D:\db\DiskSpd\x86>diskspd.exe -? Usage: diskspd.exe [options] target1 [ target2 [ target3 ...] ] version 2.1.0-dev (2021/7/1) Valid targets: file_path #<physical drive number> <drive_letter>: Available options: -? display usage information -ag group affinity - affinitize threads round-robin to cores in Processor Groups 0 - n. Group 0 is filled before Group 1, and so forth. [default; use -n to disable default affinity] -ag#,#[,#,...]> advanced CPU affinity - affinitize threads round-robin to the CPUs provided. The g# notation specifies Processor Groups for the following CPU core #s. Multiple Processor Groups may be specified, and groups/cores may be repeated. If no group is specified, 0 is assumed. Additional groups/processors may be added, comma separated, or on separate parameters. Examples: -a0,1,2 and -ag0,0,1,2 are equivalent. -ag0,0,1,2,g1,0,1,2 specifies the first three cores in groups 0 and 1. -ag0,0,1,2 -ag1,0,1,2 is equivalent. -b<size>[KMGT] block size in bytes or KiB/MiB/GiB/TiB [default=64K] -B<offs>[KMGTb] base target offset in bytes or KiB/MiB/GiB/TiB/blocks [default=0] (offset from the beginning of the file) -c<size>[KMGTb] create files of the given size. Size can be stated in bytes or KiB/MiB/GiB/TiB/blocks -C<seconds> cool down time - duration of the test after measurements finished [default=0s]. -D<milliseconds> Capture IOPs statistics in intervals of <milliseconds>; these are per-thread per-target: text output provides IOPs standard deviation, XML provides the full IOPs time series in addition. [default=1000, 1 second]. -d<seconds> duration (in seconds) to run test [default=10s] -f<size>[KMGTb] target size - use only the first <size> bytes or KiB/MiB/GiB/TiB/blocks of the file/disk/partition, for example to test only the first sectors of a disk -f<rst> open file with one or more additional access hints r : the FILE_FLAG_RANDOM_ACCESS hint s : the FILE_FLAG_SEQUENTIAL_SCAN hint t : the FILE_ATTRIBUTE_TEMPORARY hint [default: none] -F<count> total number of threads (conflicts with -t) -g<value>[i] throughput per-thread per-target throttled to given value; defaults to bytes per millisecond With the optional i qualifier the value is IOPS of the specified block size (-b). Throughput limits cannot be specified when using completion routines (-x) [default: no limit] -h deprecated, see -Sh -i<count> number of IOs per burst; see -j [default: inactive] -j<milliseconds> interval in <milliseconds> between issuing IO bursts; see -i [default: inactive] -I<priority> Set IO priority to <priority>. Available values are: 1-very low, 2-low, 3-normal (default) -l Use large pages for IO buffers -L measure latency statistics -n disable default affinity (-a) -N<vni> specify the flush mode for memory mapped I/O v : uses the FlushViewOfFile API n : uses the RtlFlushNonVolatileMemory API i : uses RtlFlushNonVolatileMemory without waiting for the flush to drain [default: none] -o<count> number of outstanding I/O requests per target per thread (1=synchronous I/O, unless more than 1 thread is specified with -F) [default=2] -O<count> number of outstanding I/O requests per thread - for use with -F (1=synchronous I/O) -p start parallel sequential I/O operations with the same offset (ignored if -r is specified, makes sense only with -o2 or greater) -P<count> enable printing a progress dot after each <count> [default=65536] completed I/O operations, counted separately by each thread -r[align[KMGTb]] random I/O aligned to <align> in bytes/KiB/MiB/GiB/TiB/blocks (overrides -s) [default alignment=block size (-b)] -rd<dist>[params] specify an non-uniform distribution for random IO in the target [default uniformly random] distributions: pct, abs all: IO% and %Target/Size are cumulative. If the sum of IO% is less than 100% the remainder is applied to the remainder of the target. An IO% of 0 indicates a gap - no IO will be issued to that range of the target. pct : parameter is a combination of IO%/%Target separated by : (colon) Example: -rdpct90/10:0/10:5/20 specifies 90% of IO in 10% of the target, no IO next 10%, 5% IO in the next 20% and the remaining 5% of IO in the last 60% abs : parameter is a combination of IO/Target Size separated by : (colon) If the actual target size is smaller than the distribution, the relative values of IO% for the valid elements define the effective distribution. Example: -rdabs90/10G:0/10G:5/20G specifies 90% of IO in 10GiB of the target, no IO next 10GiB, 5% IO in the next 20GiB and the remaining 5% of IO in the remaining capacity of the target. If the target is only 20G, the distribution truncates at 90/10G:0:10G and all IO is directed to the first 10G (equivalent to -f10G). -rs<percentage> percentage of requests which should be issued randomly. When used, -r may be used to specify IO alignment (applies to both the random and sequential portions of the load). Sequential IO runs will be homogeneous if a mixed ratio is specified (-w), and run lengths will follow a geometric distribution based on the percentage split. -R[p]<text|xml> output format. With the p prefix, the input profile (command line or XML) is validated and re-output in the specified format without running load, useful for checking or building complex profiles. [default: text] -s[i][align[KMGTb]] stride size of <align> in bytes/KiB/MiB/GiB/TiB/blocks, alignment/offset between operations [default=non-interlocked, default alignment=block size (-b)] By default threads track independent sequential IO offsets starting at offset 0 of the target. With multiple threads this results in threads overlapping their IOs - see -T to divide them into multiple separate sequential streams on the target. With the optional i qualifier (-si) threads interlock on a shared sequential offset. Interlocked operations may introduce overhead but make it possible to issue a single sequential stream to a target which responds faster than a one thread can drive. (ignored if -r specified, -si conflicts with -p, -rs and -T) -S[bhmruw] control caching behavior [default: caching is enabled, no writethrough] non-conflicting flags may be combined in any order; ex: -Sbw, -Suw, -Swu -S equivalent to -Su -Sb enable caching (default, explicitly stated) -Sh equivalent -Suw -Sm enable memory mapped I/O -Su disable software caching, equivalent to FILE_FLAG_NO_BUFFERING -Sr disable local caching, with remote sw caching enabled; only valid for remote filesystems -Sw enable writethrough (no hardware write caching), equivalent to FILE_FLAG_WRITE_THROUGH or non-temporal writes for memory mapped I/O (-Sm) -t<count> number of threads per target (conflicts with -F) -T<offs>[KMGTb] starting stride between I/O operations performed on the same target by different threads [default=0] (starting offset = base file offset + (thread number * <offs>) only applies with #threads > 1 -v verbose mode -w<percentage> percentage of write requests (-w and -w0 are equivalent and result in a read-only workload). absence of this switch indicates 100% reads IMPORTANT: a write test will destroy existing data without a warning -W<seconds> warm up time - duration of the test before measurements start [default=5s] -x use completion routines instead of I/O Completion Ports -X<filepath> use an XML file to configure the workload. Combine with -R, -v and -z to override profile defaults. Targets can be defined in XML profiles as template paths of the form *<integer> (*1, *2, ...). When run, specify the paths to substitute for the template paths in order on the command line. The first specified target is *1, second is *2, and so on. Example: diskspd -Xprof.xml first.bin second.bin (prof.xml using *1 and *2) -z[seed] set random seed [with no -z, seed=0; with plain -z, seed is based on system run time] Write buffers: -Z zero buffers used for write tests -Zr per IO random buffers used for write tests - this incurrs additional run-time overhead to create random content and shoul not be compared to results run without -Zr -Z<size>[KMGb] use a <size> buffer filled with random data as a source for write operations. -Z<size>[KMGb],<file> use a <size> buffer filled with data from <file> as a source for write operations. By default, the write buffers are filled with a repeating pattern (0, 1, 2, ..., 255, 0, 1, ...) Synchronization: -ys<eventname> signals event <eventname> before starting the actual run (no warmup) (creates a notification event if <eventname> does not exist) -yf<eventname> signals event <eventname> after the actual run finishes (no cooldown) (creates a notification event if <eventname> does not exist) -yr<eventname> waits on event <eventname> before starting the run (including warmup) (creates a notification event if <eventname> does not exist) -yp<eventname> stops the run when event <eventname> is set; CTRL+C is bound to this event (creates a notification event if <eventname> does not exist) -ye<eventname> sets event <eventname> and quits Event Tracing: -e<q|c|s> Use query perf timer (qpc), cycle count, or system timer respectively. [default = q, query perf timer (qpc)] -ep use paged memory for the NT Kernel Logger [default=non-paged memory] -ePROCESS process start & end -eTHREAD thread start & end -eIMAGE_LOAD image load -eDISK_IO physical disk IO -eMEMORY_PAGE_FAULTS all page faults -eMEMORY_HARD_FAULTS hard faults only -eNETWORK TCP/IP, UDP/IP send & receive -eREGISTRY registry calls Examples: Create 8192KB file and run read test on it for 1 second: diskspd.exe -c8192K -d1 testfile.dat Set block size to 4KB, create 2 threads per file, 32 overlapped (outstanding) I/O operations per thread, disable all caching mechanisms and run block-aligned random access read test lasting 10 seconds: diskspd.exe -b4K -t2 -r -o32 -d10 -Sh testfile.dat Create two 1GB files, set block size to 4KB, create 2 threads per file, affinitize threads to CPUs 0 and 1 (each file will have threads affinitized to both CPUs) and run read test lasting 10 seconds: diskspd.exe -c1G -b4K -t2 -d10 -a0,1 testfile1.dat testfile2.dat |
参数说明
最常用参数介绍:
| 参数名 | 说明 |
|---|---|
| -b | 表示块大小(以字节、KiB、MiB 或 GiB为单位),默认块大小为 64 KiB。 |
| -c | 设置测试中创建使用的示例文件大小。 可以按字节、KiB、MiB、GiB 或块进行设置。 |
| -D | 捕获 IOPS 统计信息(例如标准偏差),时间间隔为毫秒[default=1000,1second]。 |
| -d | 指定测试的持续时间,不包括冷却或预热时间。 默认值为 10 秒,但对于任何繁重的工作负荷,建议至少使用 60 秒。 |
| -L | 度量延迟统计信息。 |
| -o | 表示每个线程的每个目标的未完成 I/O 请求数, 也称为队列深度。 |
| -r | 随机 I/O 对齐测试,默认值为4K,不加-r为顺序I/O测试。 |
| -Suw | 禁用软件和硬件写入缓存(等效于 -Sh)。 |
| -t | 表示每个目标的线程数,默认是单线程。 |
| -w | 指定属于写入请求操作的百分比(不写-w或-w或者-w0 等效于100%读取)。 如:-w25代表有25%的写,75%的读。 |
diskspdming命令参数说明:
-o 用于设置每个目标线程的未完成 I/O 请求的数。1表示进程同步,2表示进程异步。
-b[K|M|G] 表示测试的块大小(以字节、KiB、MiB 或 GiB为单位),默认块大小为 64 KiB。
-r[K|M|G] 随机 I/O 对齐测试,默认值为4K,不加-r为顺序I/O测试。
-w 用于指定写入请求的百分比,默认写入请求为读取请求的 100%。50%-表示读写测试各50%
-d 用于指定测试时长,默认为 10 秒(不包括冷却和预热时间)
-Sh 禁用软件和硬件写入缓存
-D捕获 IOPS 统计信息(例如标准偏差),时间间隔为毫秒[default=1000,1second]。
-L 度量延迟统计信息。
-c[K|M|G|b] 设置测试中创建使用的示例文件大小。 可以按字节、KiB、MiB、GiB 或块进行设置。
其它参数:
1 2 3 4 5 6 7 8 9 10 11 12 13 14 15 16 17 18 19 20 21 22 23 24 25 26 27 28 29 30 31 32 33 34 35 36 37 38 39 40 41 42 43 44 45 46 47 48 49 50 51 52 53 54 55 56 57 58 59 60 61 62 63 64 65 66 67 68 69 70 71 72 73 74 75 76 77 78 79 80 81 82 83 84 85 86 87 88 89 90 91 92 93 94 95 96 97 98 99 100 101 102 103 104 105 106 107 108 109 110 111 112 113 114 115 116 117 118 119 120 121 122 123 124 125 126 127 128 129 130 131 132 133 134 135 136 137 138 139 140 141 142 143 144 145 146 147 148 | #### 可测试目标: file_path 文件abc.file #<physical drive number> #1为第一块物理磁盘[谨慎,别拿系统盘测试,一般用于准备投入的数据磁盘测试] <partition_drive_letter>: 盘符c: #### 可用的选项: -ag 以轮询方式将进程和CPU Group绑定,默认从Group 0开始,然后group 1,依次进行.[我的理解是超过64个逻辑核才会出现group1,而且Win2008, Vista, 2003 XP都不支持Processor Groups][80个逻辑CPU可能会出现不均衡Process Group问题,如80core时,group0可能有60core,group1有20core,系统调度变得好复杂] 关于Processor Groups请参考https://docs.microsoft.com/en-us/windows/desktop/procthread/processor-groups -ag#,#[,#,...]> 高级版CPU与线程绑定参数.使用-n禁用默认关联.[这个参数真的是用在比较高级的数据库服务器上,比如超过64个核心,支持热插拔CPU等] -a0,1,2 和-ag0,0,1,2是一样的. -ag0,0,1,2,g1,0,1,2指定了组0和组1中的前三个核心。 -ag0,0,1,2和-ag1,0,1,2是一样婶的. -b<size>[K|M|G] 块大小,单位bytes,默认为64K,单位可以是KMG -B<offs>[K|M|G|b] 以字节为单位的基本目标偏移量.默认为0,不偏移.例如diskspd -b4K -B512b #1 ,这样可以躲开分区表,我没试过哦! -c<size>[K|M|G|b] 创建文件的大小 -C<seconds> 冷却时间-测量完成后测试的持续时间.默认为0 -D<milliseconds> 捕获IOPs统计信息的时间间隔,默认1000ms. -d<seconds> 测试持续时间,默认10s. -f<size>[K|M|G|b] 目标大小,目标可以为文件,磁盘,分区. -f<rst> 使用附加访问提示打开文件.一般启用软件缓存时才适用 -fr:文件标志随机访问提示. -fs:文件标志顺序扫描提示. -ft:文件属性临时提示. -F<count> 每文件的线程总数,与-t冲突. -g<bytes per ms> 调整每ms给定每个线程或每个目标的字节数.此选项与完成例程(-x)不兼容.[默认:不活动].[编程用] -h 弃用,查看-Sh -i<count> 每次发送的IO数量,一般和-j联用.[默认:不活动] -j<milliseconds> 定义一次IO发送间隔<毫秒>;一般和-i联用[默认:不活动] -I<priority> 设置IO优先级.1-非常低,2-低,3-普通(默认) -l 使用大页面作为IO缓冲区 -L 记录IO延时的统计数据 -n 禁用默认的亲和力 -o<count> 队列深度.(1=同步I/O,除非使用-F指定了多个线程)[默认值=2] -O<count> 允许未完成几个I/O的情况下继续发送请求,和-f一起使用(1=同步I/O) -p 启动具有相同偏移量的并行顺序I/O操作(如果指定-r则忽略,只在-o2或更大时才有意义) -P<count> 完成<count>个I/O操作后打印进度点(类似进度条,不是进度条),按每个线程分别计算.默认值为65536. -r<align>[K|M|G|b] 随机I/O参数.一般单独使用-r,此时偏移量是块对齐的.带参数时,在每次I/O操作之前,将随机选择执行I/O操作的文件偏移量。所有偏移量都与-r参数指定的大小对齐。-r不能与-s参数一起使用,因为-s定义了下一个I/O操作的偏移量,在随机I/O的情况下,下一个操作的偏移量不是一个常量。如果指定-r和-s,则-r覆盖-s。 -R<text|xml> 输出格式,默认为文本格式. -s[i]<size>[K|M|G|b] 不完全顺序操作,增加I/O偏移量,指定-r时会自动忽略本参数.一般使用-si.与-T,-p冲突. -S[bhmruw] 控制缓存行为[diskspd默认:启用缓存],与后面的bhmruw参数随意组合. -S 等同于-Su -Sb 启用缓存,默认情况下即启用此参数. -Sh 相当于suw,禁用软件/硬件缓存.常用选项. -Sm 启用内存映射I/O -Su 禁用软件缓存 -Sr 禁用本地缓存,启用远程sw缓存;仅对远程文件系统有效 -Sw 禁用硬件写缓存 -t<count> 每个目标的线程数(与-F冲突)[单文件下可以参考设置为CPU总核心数,未测试] -F会让-t的区别 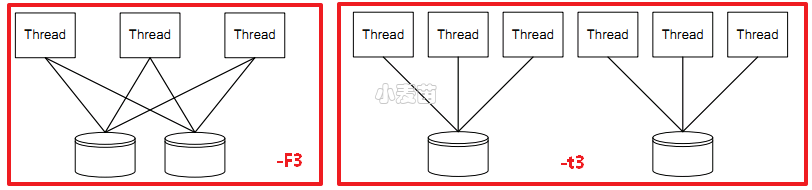 -T<offs>[K|M|G|b] 不同线程在相同目标上执行的I/O操作之间的偏移量,每个目标的线程数大于1时才有意义.默认为0.起始偏移量=基本文件偏移量+(线程数*偏移量) -b,-B,-f,-T,-s之间的关系可参照下图: 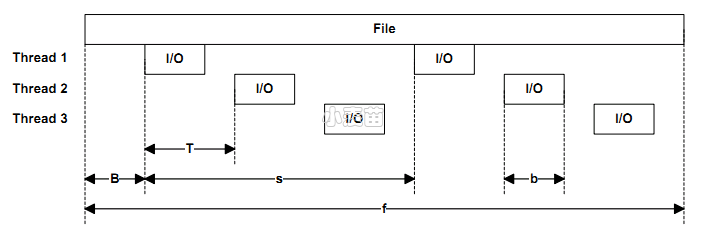 -v 详细模式 -w<percentage> 写请求的百分比.-w0和-w等效,即为读测试. -W<seconds> 预热时间-测量开始前测试持续时间[默认=5s] -x 使用完成例程而不是I/O完成端口.[编程用][除非有特定的原因来探究组合模型中的差异,否则通常应该保持默认状态。] -X<filepath> 使用XML文件配置工作负载。不能与其他参数一起使用。 -z[seed] 参数控制DISKSPD随机数发生器的初始状态,默认为0 -N<vni> [未翻译] 写缓存: -Z 将缓冲区填充为0用于写测试.默认情况下,写缓冲区填充模式为(0, 1, 2, ..., 255, 0, 1, ...) -Zr 每个IO设置随机缓冲区用于写测试-这将导致额外的开销用以创建随机内容.不能与没有-Zr运行的结果进行比较. -Z<size>[K|M|G|b] 为写操作提供随机数据 -Z<size>[K|M|G|b],<file> 使用文件作为数据源来填充写源缓冲区。 同步:[不翻译了] 指定可以用于启动、结束、取消或发送磁盘spd通知的事件 事件追踪:[未翻译] MT标注:对于顺序读写的偏移量,我实在没搞太明白,在此标注一下: 标注1: The -s sequential I/O parameter specifies the stride from the prior I/O to the next operation. For example, if a 64KiB stride is chosen for a 4KiB block size, the first IO will be at zero, the second at 64KiB, and so forth. After the whole file is read, I/O resumes at the base offset (-B) or zero, as appropriate. If multiple threads operate on a single target, the threads will operate independently and the target will see multiple sequential streams. This is most useful with sequential stride (-T). If the optional interlocked (i) qualifier is used, -si, a single interlocked offset is shared between all threads operating on a given target. This mode is most useful when a single sequential pattern is desired and a single thread is unable to fully drive very fast storage. 标注2:跳跃读性能测试: 在0偏移量处读4Kbytes,然后间隔200Kbytes,读4Kbytes,再间隔200Kbytes,如此反复。此时的模式是读4Kbytes,间隔200Kbytes并重复这个模式。这又是一个典型的应用行为,文件中使用了数据结构并且访问这个数据结构的特定区域的应用程序常常这样做。许多操作系统并没注意到这种行为或者针对这种类型的访问做一些优化。同样,这种访问行为也可能导致一些有趣的性能异常。一个例子是在一个数据片化的文件系统里,应用程序的跳跃导致某一个特定的磁盘成为性能瓶颈。 |
Sample command lines
Note that there also some additional examples in Section 3 when describing more complex options.
| Test description | Sample command |
|---|---|
| Large area random concurrent reads of 4KB blocks | diskspd -c2G -b4K -F8 -r -o32 -W60 -d60 -Sh testfile.dat |
| Large area random concurrent writes of 4KB blocks | diskspd -c2G -w100 -b4K -F8 -r -o32 -W60 -d60 -Sh testfile.dat |
| Large area random serial reads of 4KB blocks. | diskspd -c2G -b4K -r -o1 -W60 -d60 -Sh testfile.dat |
| Large area random serial writes of 4KB blocks | diskspd -c2G -w100 -b4K -r -o1 -W60 -d60 -Sh testfile.dat |
| Large area sequential concurrent reads of 4KB blocks | diskspd -c2G -b4K -F8 -T1b -s8b -o32 -W60 -d60 -Sh testfile.dat |
| Large area sequential concurrent writes of 4KB blocks | diskspd -c2G -w100 -b4K -F8 -T1b -s8b -o32 -W60 -d60 -Sh testfile.dat |
| Large area sequential serial reads of 4KB blocks | diskspd -c2G -b4K -o1 -W60 -d60 -Sh testfile.dat |
| Large area sequential serial writes of 4KB blocks | diskspd -c2G -w100 -b4K -o1 -W60 -d60 -Sh testfile.dat |
| Small area concurrent reads of 4KB blocks | diskspd -c100b -b4K -o32 -F8 -T1b -s8b -W60 -d60 -Sh testfile.dat |
| Small area concurrent writes of 4KB blocks | diskspd -c100b -w100 -b4K -o32 -F8 -T1b -s8b -W60 -d60 -Sh testfile.dat |
| Display statistics about physical disk I/O and memory events from the NT Kernel Logger | diskspd -eDISK_IO -eMEMORY_PAGE_FAULTS testfile.dat |
| Specify 90% of I/O to 10% of the target, 0% of I/O to the next 10% of the target, 5% of I/O to the next 20% of target and the remaining 5% of I/O to the remaining 60% of target (implied), using -rdpct. | diskspd -c1G -b4K -r -o32 -w0 -d60 -Sh -rdpct90/10:0/10:5/20 testfile.dat |
| Specify 90% of I/O to 10GiB of the target, 0% of I/O to the next 10GiB, 5% of I/O to the next 20GiB and the remaining 5% of I/O to the remaining target file size, using -rdabs. | diskspd -c1G -b4K -r -o32 -t1 -w0 -d60 -Sh -rdabs90/10G:0/10G:5/20G testfile.dat |
| Mix random and sequential workloads (20% random and 80% sequential I/O) | diskspd -c1G -b4K -o32 -t1 -r8b -w50 -rs20 -d60 -Sh testfile.dat |
| Limit IOPS to 1000 per thread | diskspd -c1G -b4K -o32 -t1 -w50 -g1000i -d60 -Sh testfile.dat |
| Create a text profile from a set of parameters | diskspd -t1 -o4 -b4k -r4k -w0 -Sh -D -d60 -L -c1G -Rptext > profile.txt |
| Create an XML profile from a set of parameters | diskspd -t1 -o4 -b4k -r4k -w0 -Sh -D -d60 -L -c1G -Rpxml *1 *2 > profile.xml |
| Substitute target files from a previously created XML profile (see above) | diskspd -Xprofile.xml file1.dat, file2.dat |
测试
如下命令:
1 | diskspd.exe -c64M -b64K -t1 -o32 -si64K -w50 -S D:\test.dat |
其各参数含义:
- c64M,创建测试文件大小为64MB
- b64K,块大小为64KB,即读写过程中每一个IO请求操作的数据大小为64KB
- t1,每个目标的线程数,即测试D:\test.dat文件使用线程数为1
- o32,队列深度,即内部IO请求队列的最大容量为32
- si64K,IO操作步进偏移大小
- w50,写请求的百分比,即写IO比例50%,读IO比例50%
- S,禁用软件缓存,采用此选项时,测出的结果更接近实际硬件速度;若启用了缓存,则测试结果会大大高于实际硬件速度。
按上述参数创建测试文件D:\test.dat,并进行测试,默认测试时间持续10s。
示例
- 使用2个线程和1个未完成的IO进行4KB顺序写入
- 使用2个线程和1个未完成的IO进行64KB顺序写入
- 8KB随机读取使用2个线程,1个未完成的IO
- 使用2个线程和1个未完成的IO进行128KB随机读取
1 2 3 4 | diskspd.exe -c100G -t2 -si4K -b4K -d30 -L -o1 -w100 -D -h H:\testfile.dat > 4K_Sequential_Write_2Threads_1OutstandingIO.txt diskspd.exe -t2 -si64K -b64K -d30 -L -o1 -w100 -D -h H:\testfile.dat > 64KB_Sequential_Write_2Threads_1OutstandingIO.txt diskspd.exe -r -t2 -b8K -d30 -L -o1 -w0 -D -h H:\testfile.dat > 8KB_Random_Read_2Threads_1OutstandingIO.txt diskspd.exe -r -t2 -b128K -d30 -L -o1 -w0 -D -h H:\testfile.dat > 128KB_Random_Read_2Threads_1OutstandingIO.txt |
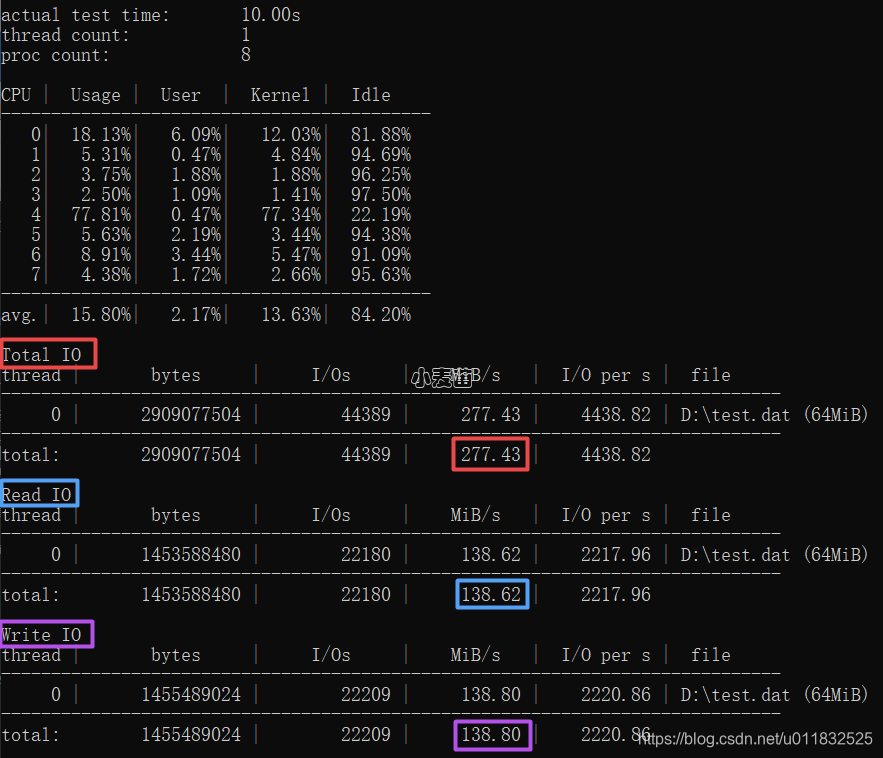
测试结果解读
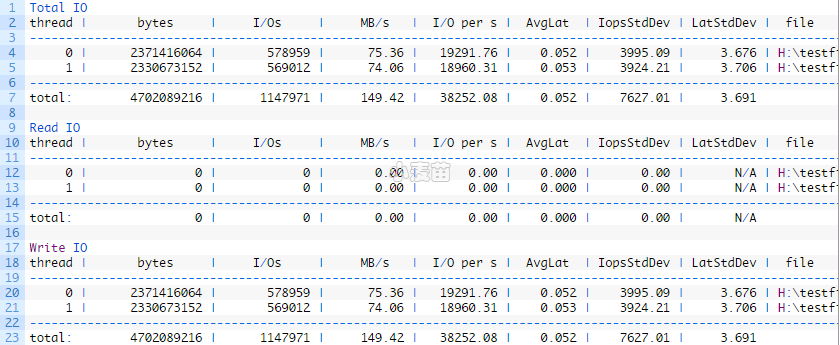
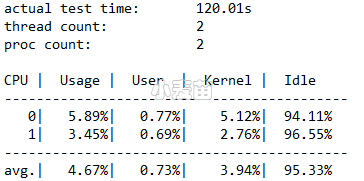
- thread:生成IO的线程的编号
- bytes:为测试传输的总字节数
- I/Os:为测试执行的IO操作总数
- MB/s:吞吐量,以MB /秒为单位
- I/O per s:每秒的IO操作数
- AvgLat:测试的所有IO操作的平均延迟
- IopsStdDev:每秒IO操作的标准偏差
- LatStdDev:测试遇到的延迟的标准偏差
- file:IO测试中使用的文件的路径
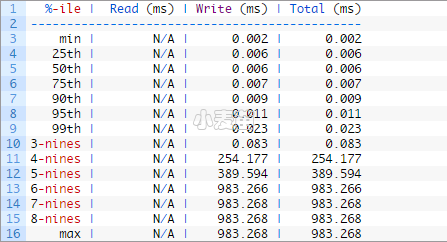
99.9%[3-nines]的write操作延时为0.083,还是比较好的。
Microsoft建议日志延迟应该在1-5ms到数据延迟应该在4-20ms之间。
输出的四个主要部分:


